FINANCIAL HIGHLIGHTS
| FY2019 RM'OOO |
FY2020 RM'OOO |
FY2021 RM'OOO |
FY2022 RM'OOO |
FY2023 RM'OOO |
|
|---|---|---|---|---|---|
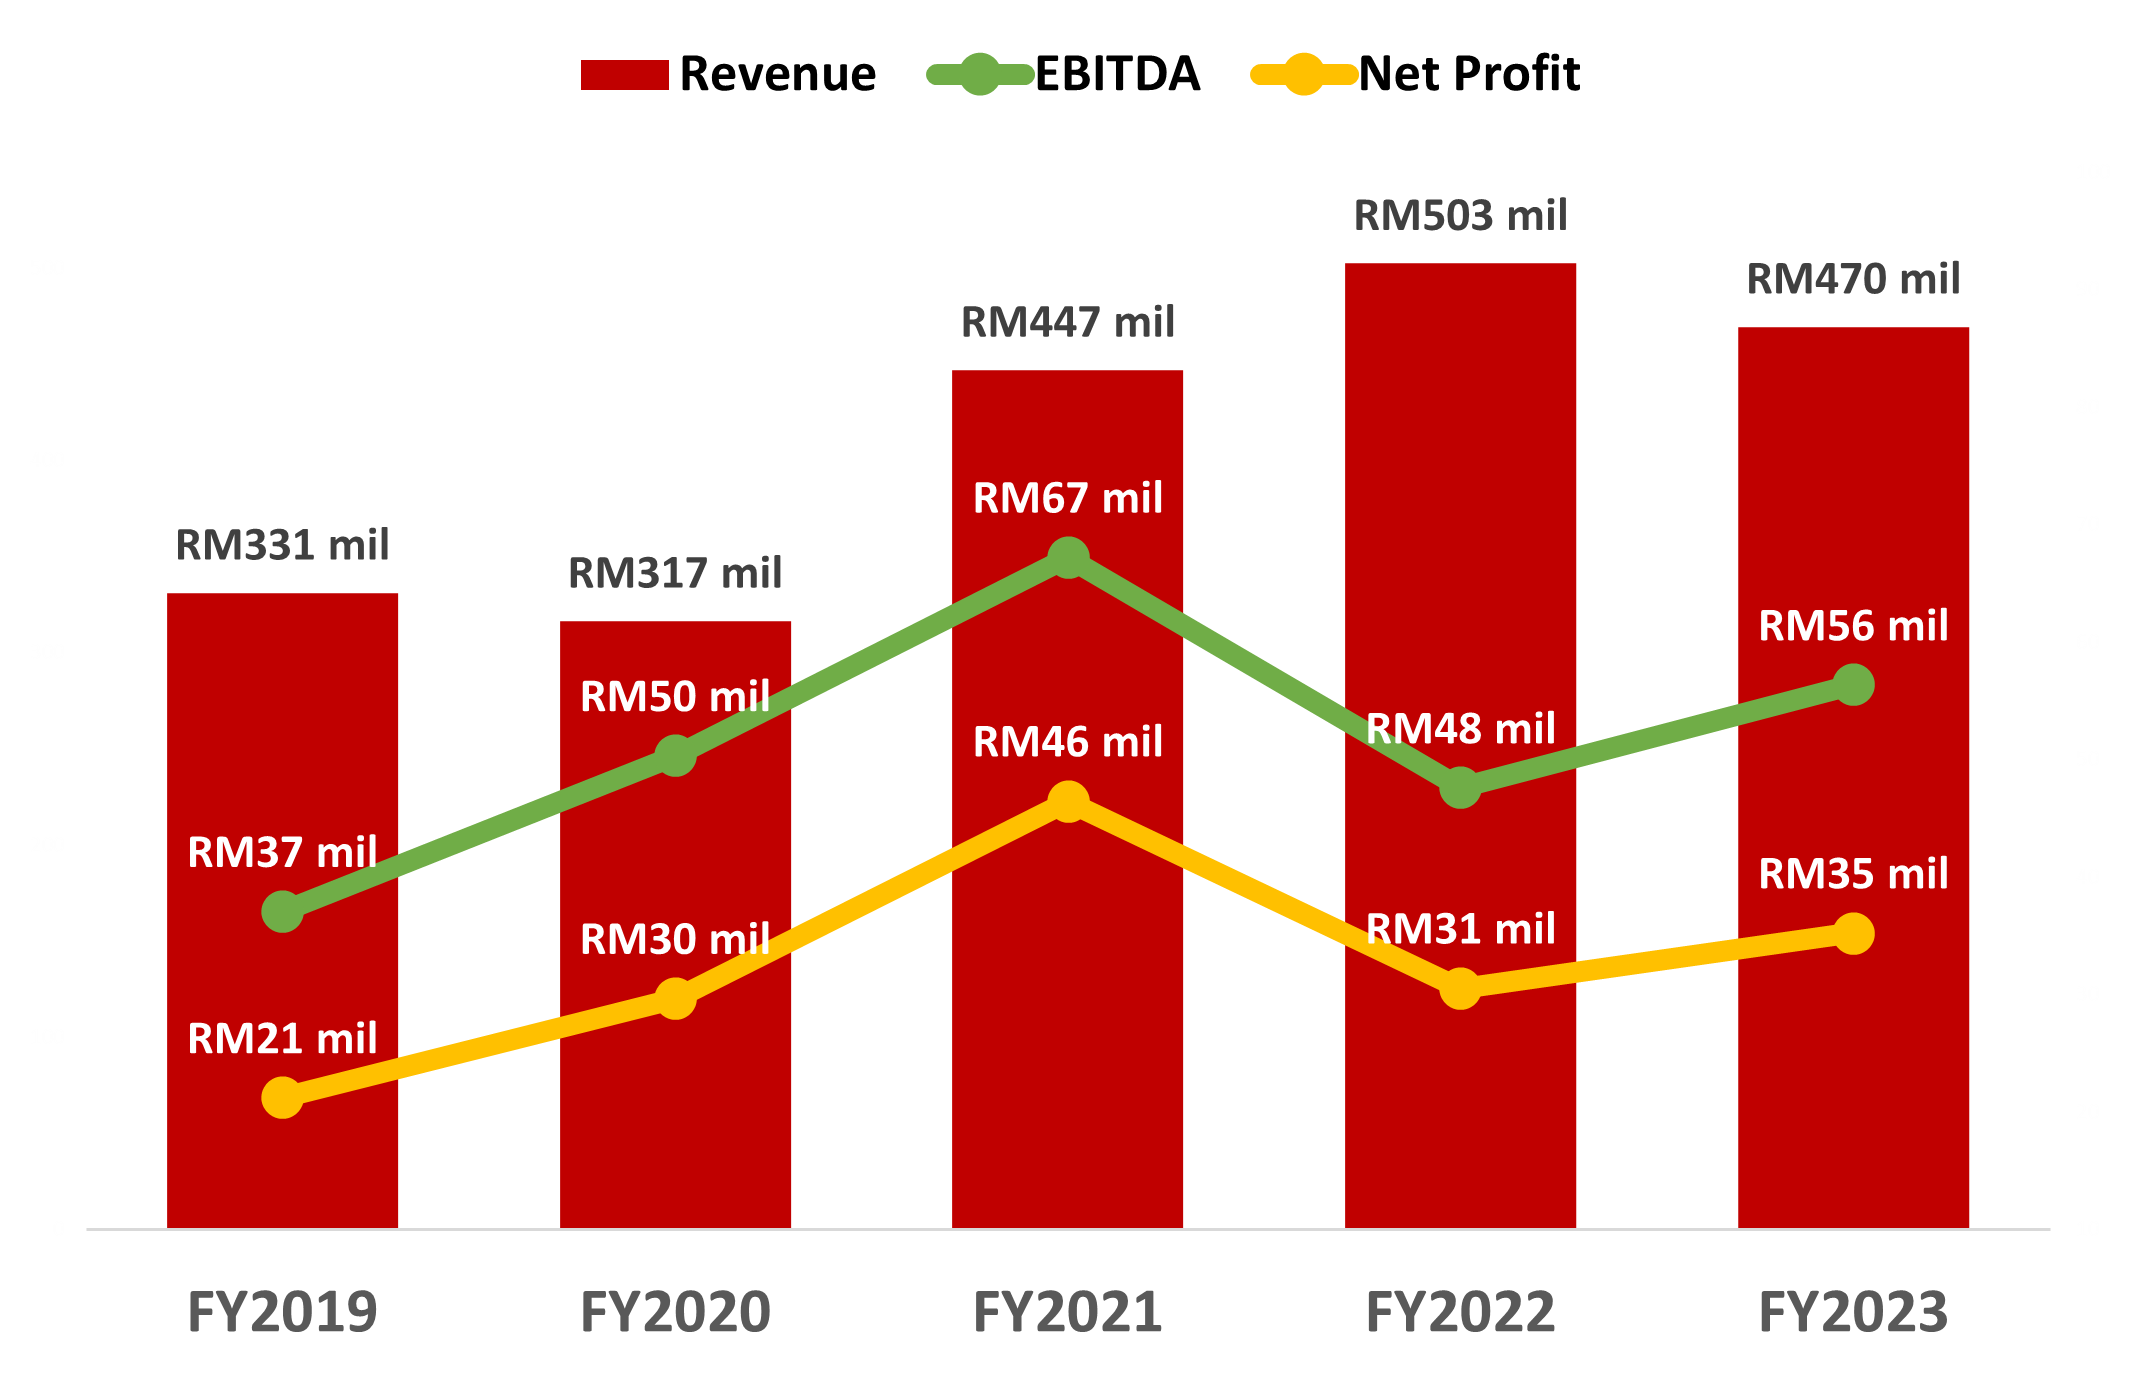
| Revenue | 331,192 | 316,597 | 447,128 | 502,595 | 469,600 |
| EBITDA | 37,055 | 50,318 | 67,216 | 47,577 | 56,343 |
| Profit before Tax ("PBT") | 26,345 | 38,923 | 56,771 | 36,008 | 42,624 |
| Net Profit / Profit after Tax PAT") | 21,204 | 29,661 | 46,466 | 30,538 | 35,234 |
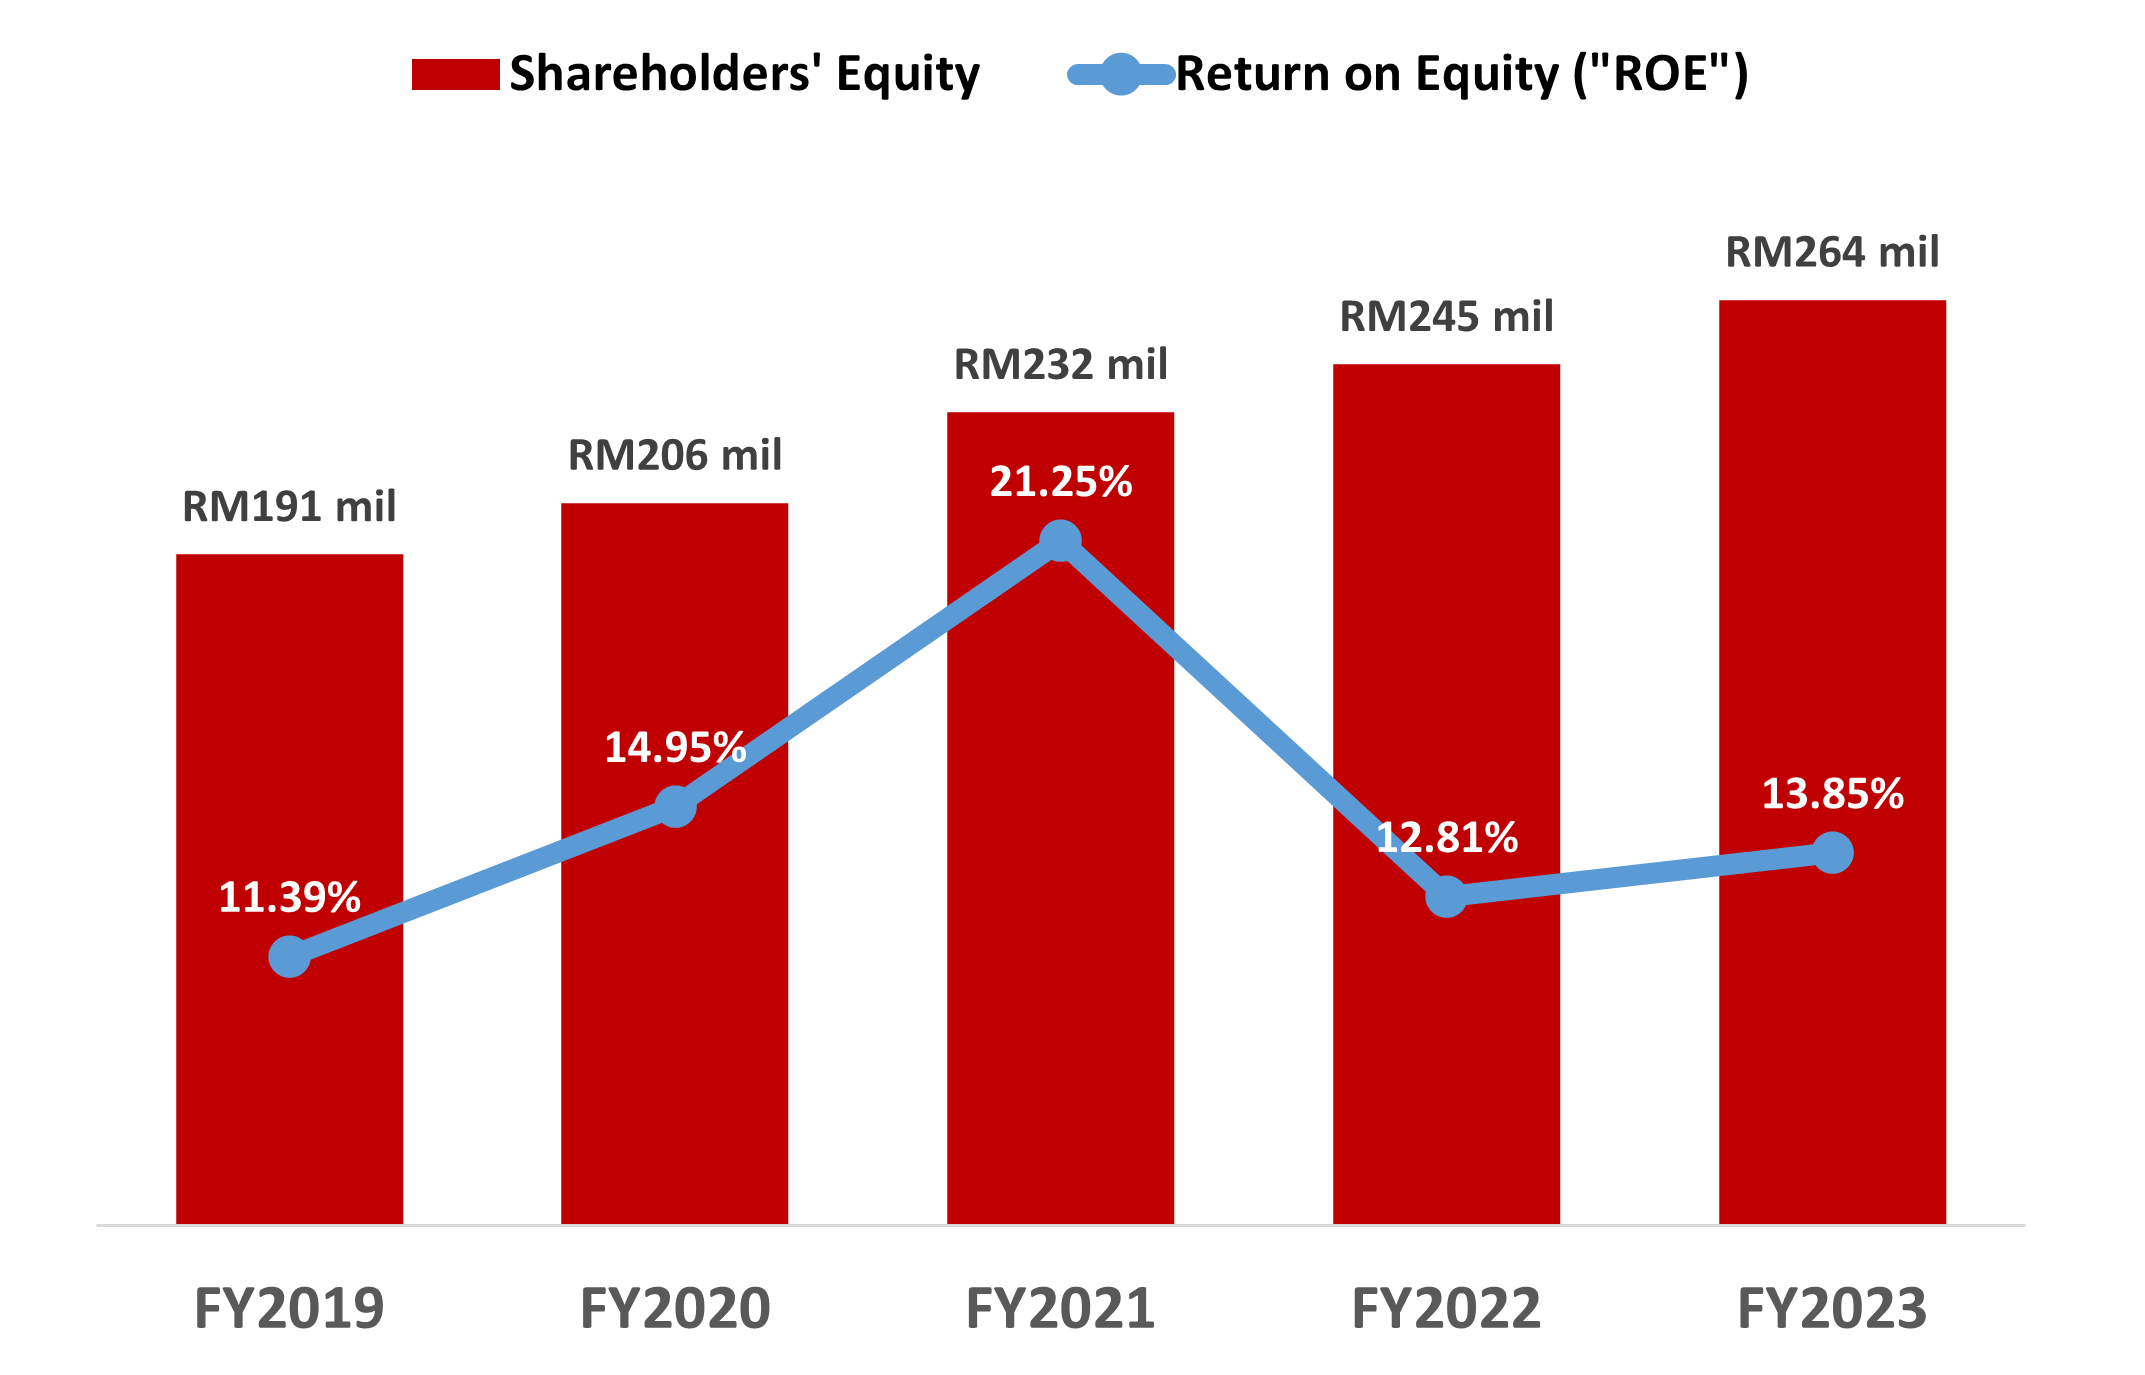
| Shareholders' Equity | 191,140 | 205,789 | 231,613 | 245,262 | 263,607 |
| Retum on Equity ("ROE") | 11% | 15% | 21% | 13% | 14% |
| Total Assets | 227,829 | 235,702 | 287,697 | 316,394 | 306,574 |
| Net Tangible Assets ("NTA") | 191,140 | 205,789 | 231,613 | 245,262 | 231,613 |
| Non-Current Assets | 86,944 | 78,704 | 95,322 | 126,073 | 140,110 |
| Return on Non-Current Assets | 24% | 38% | 49% | 24% | 25% |
| EBITDA Margin | 11% | 16% | 15% | 9% | 12% |
| PBT Margin | 8% | 12% | 13% | 7% | 9% |
| PAT Margin | 6% | 9% | 10% | 6% | 8% |
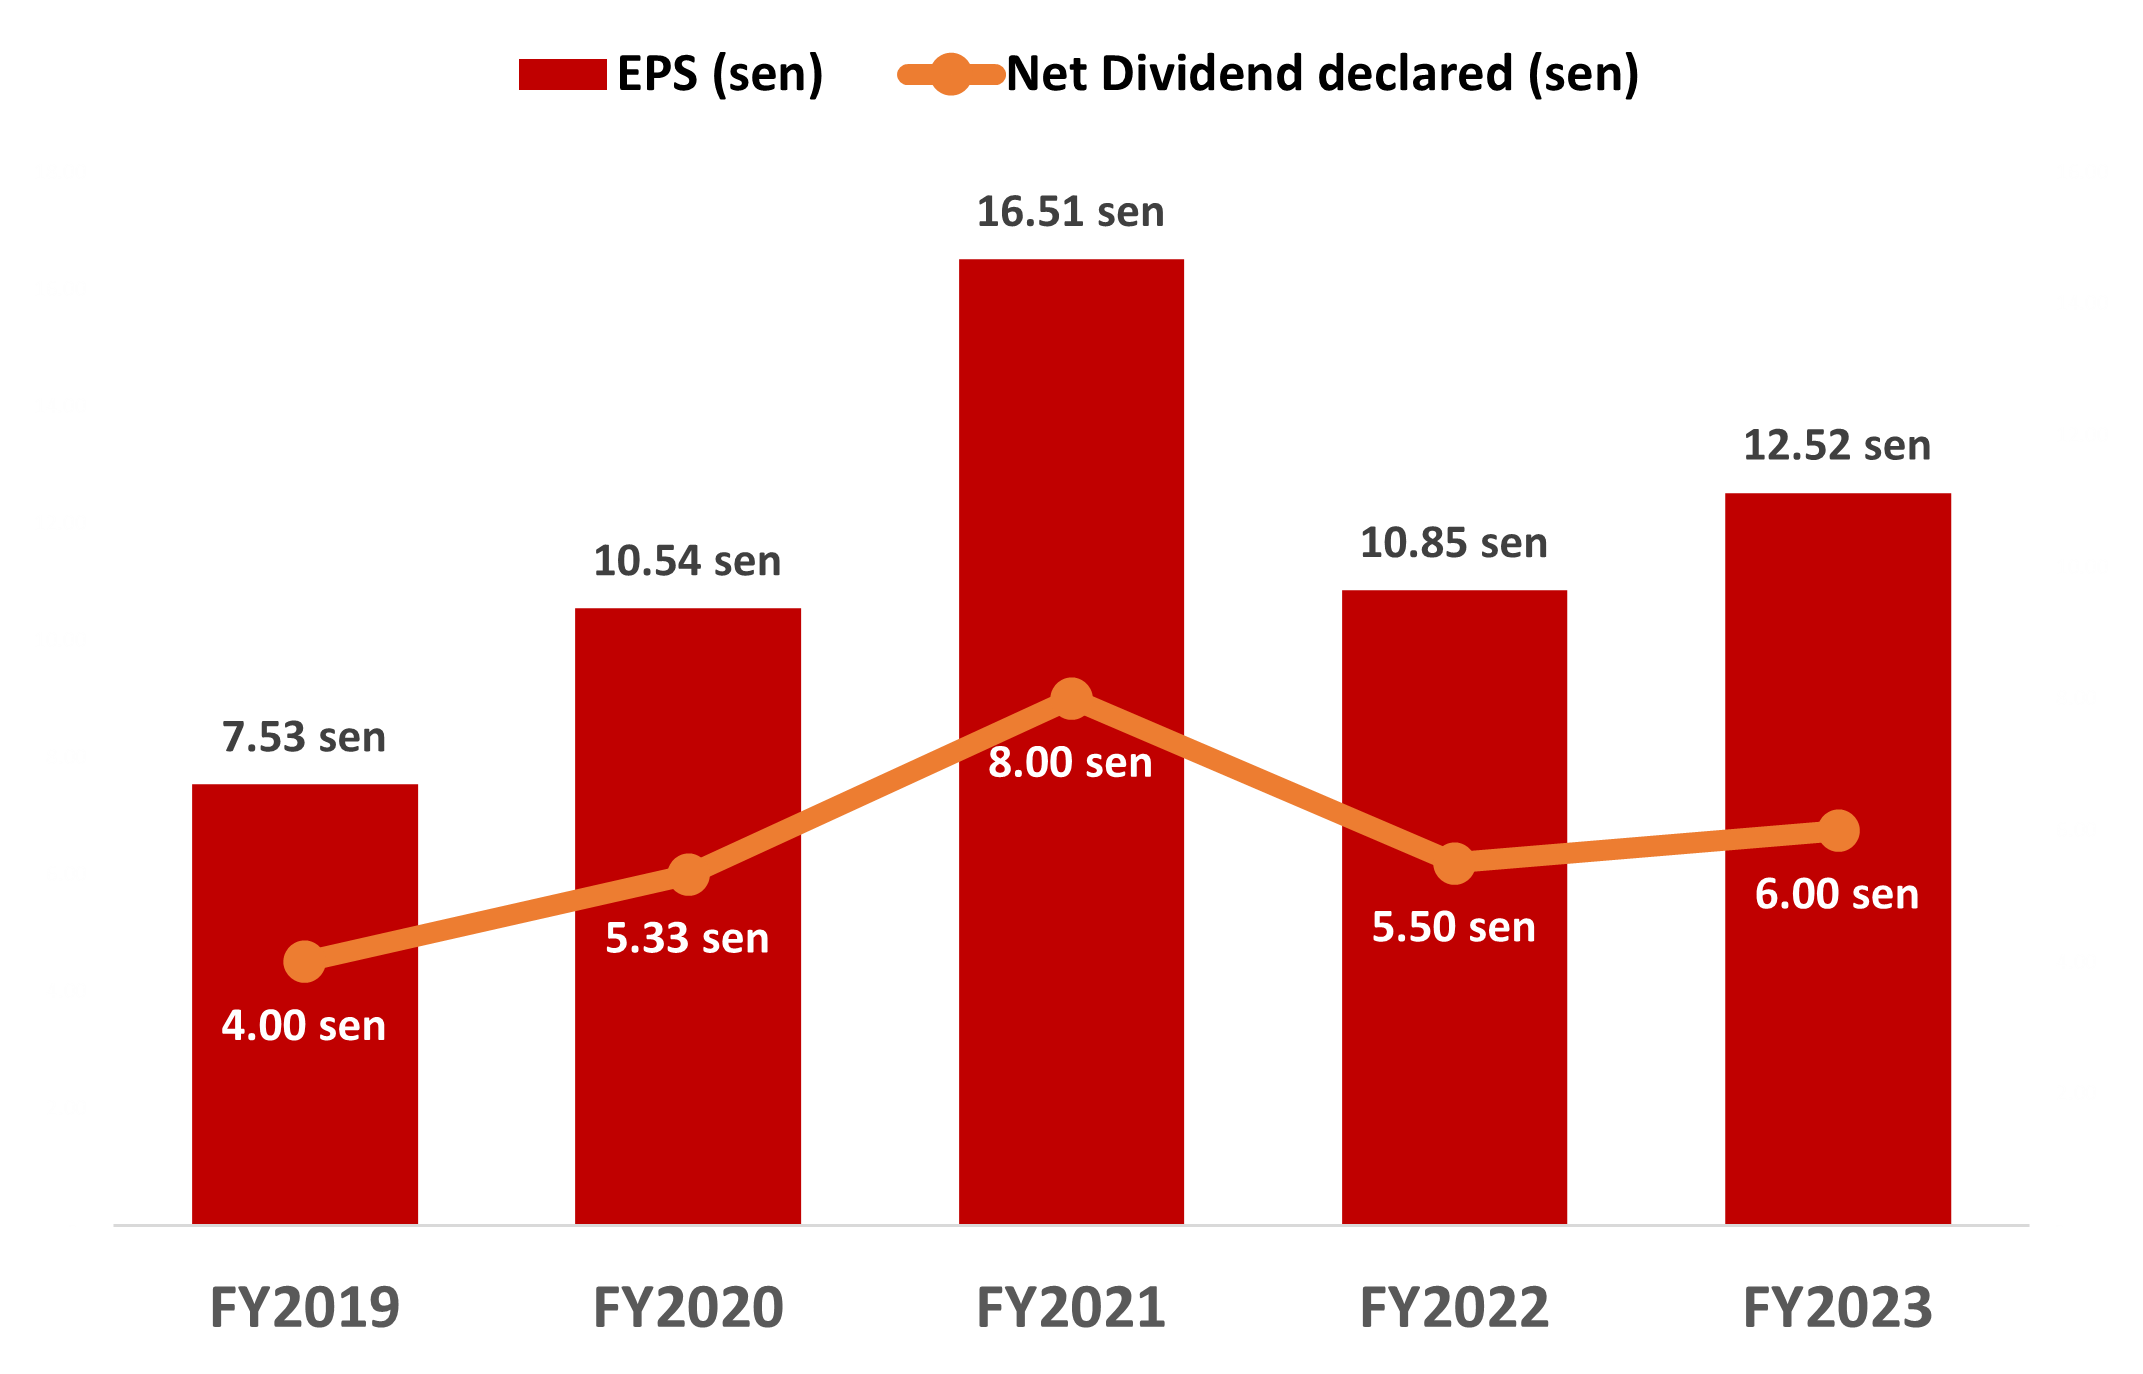
| EPS (sen)* | 7.53 | 10.54 | 16.51 | 10.85 | 12.52 |
| Net Dividend declared (sen)* | 4.00 | 5.33 | 8.00 | 5.50 | 6.00 |
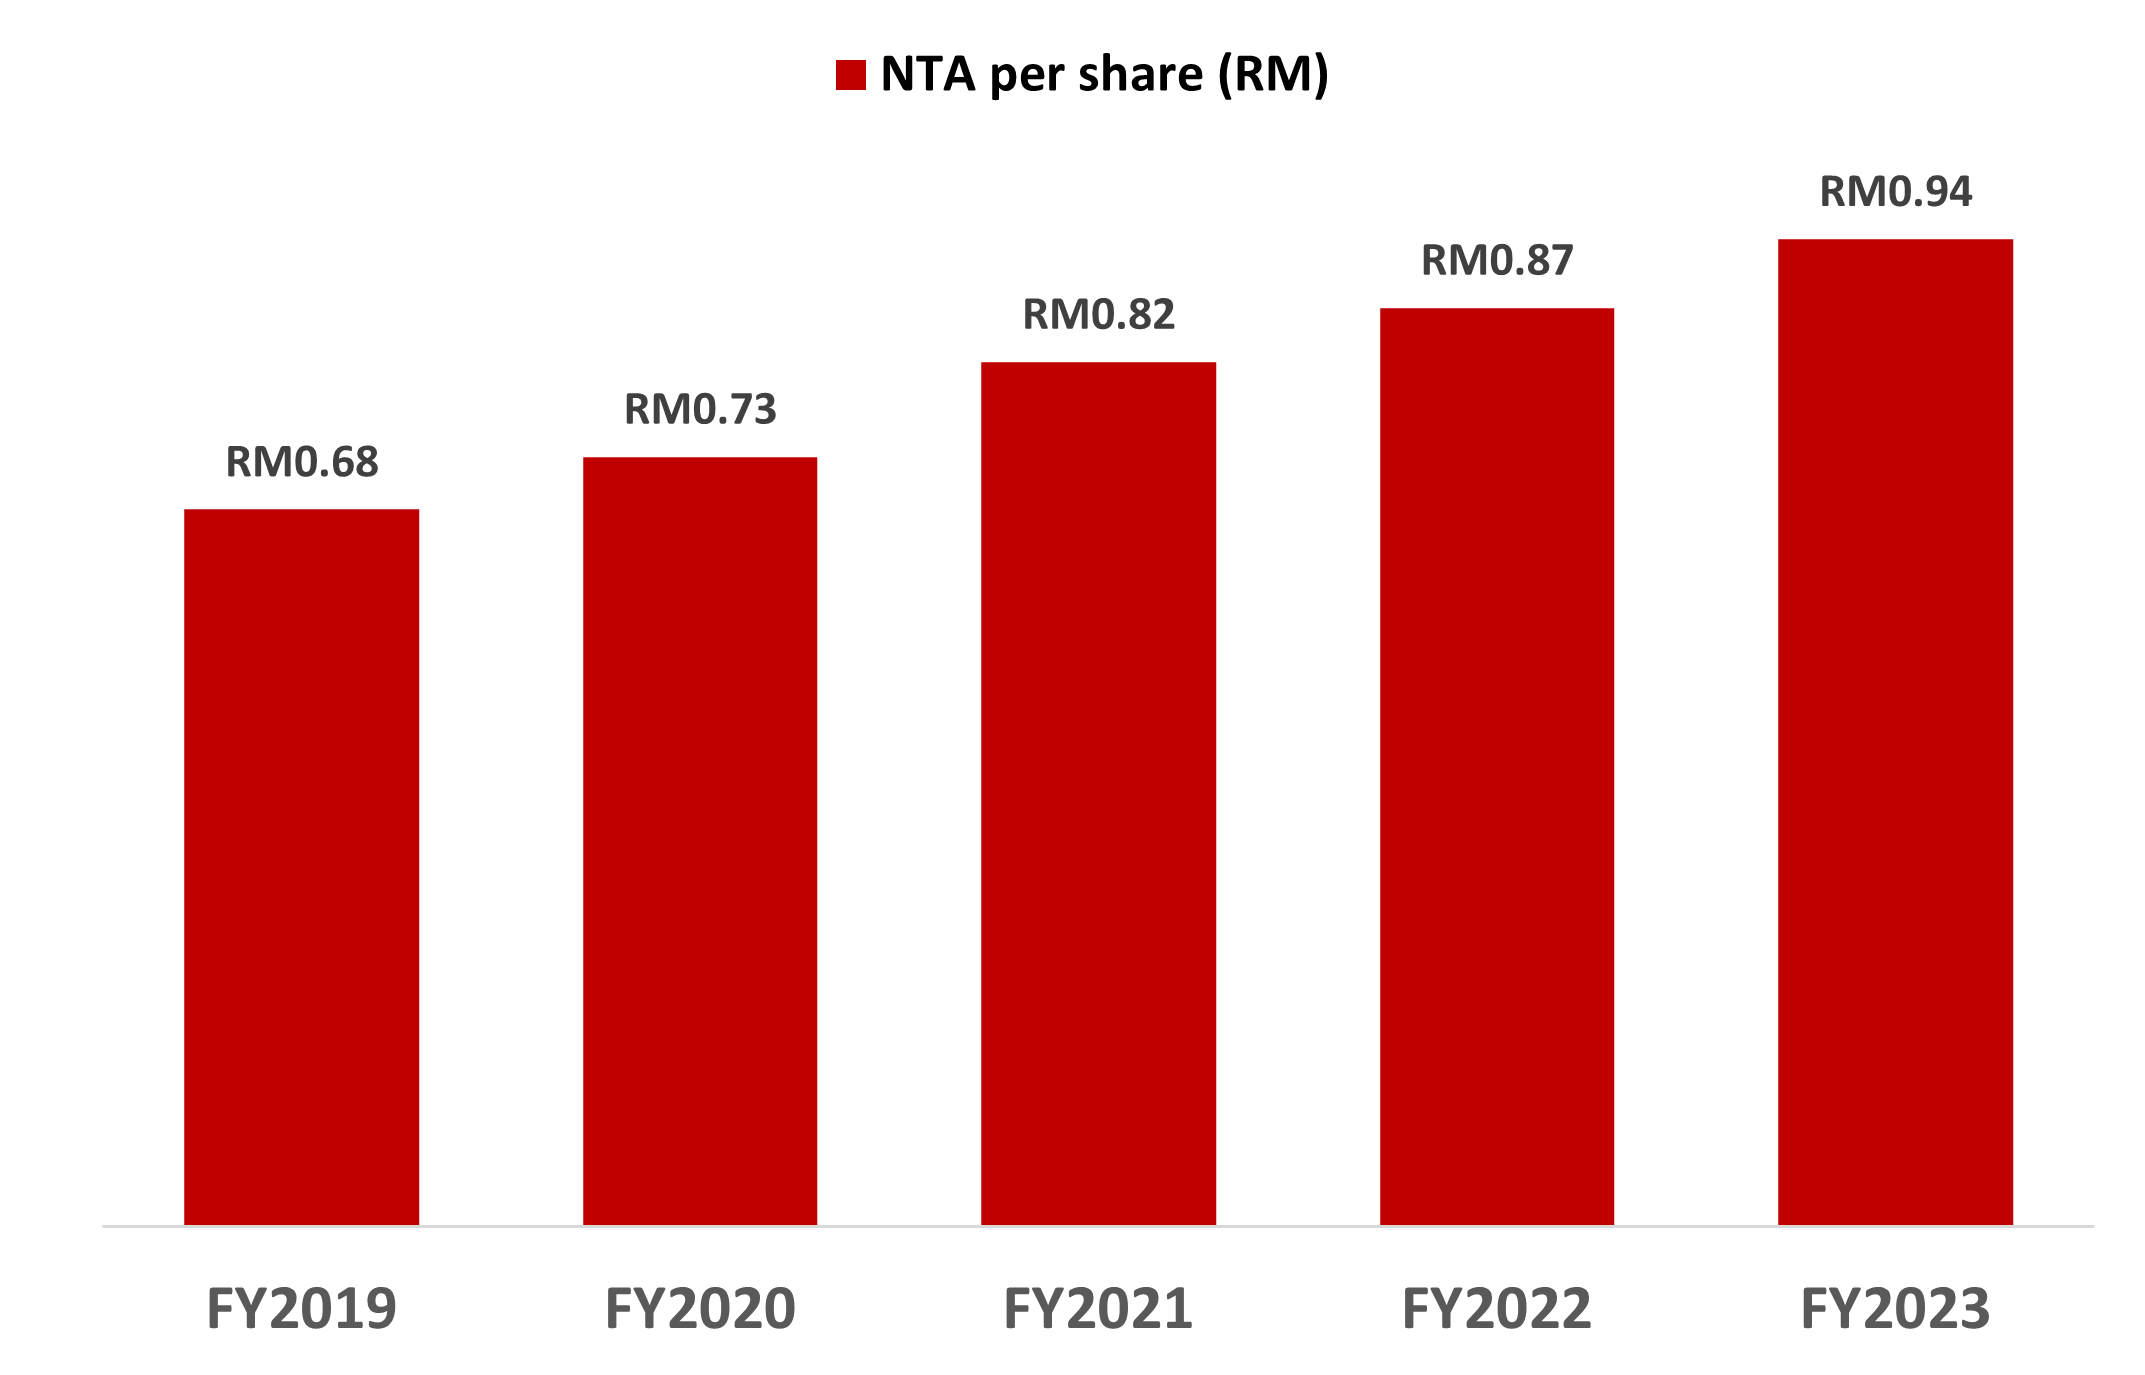
| NTA per share (RM)* | 0.68 | 0.73 | 0.82 | 0.87 | 0.94 |
* The figures are restated to reflect the bonus issue of 1 for every 2 existing ordinary shares completed on 13 December 2021.